






We turn surgeons' steady hands into 2-million-view Reels and patient discharge moments into story arcs that fill waiting rooms. HIPAA-compliant. Scroll-stopping. Booked solid.
Don't read about capabilities.
Discover them.
Click any case to open the full story — challenge, strategy, sample posts, and outcome metrics.
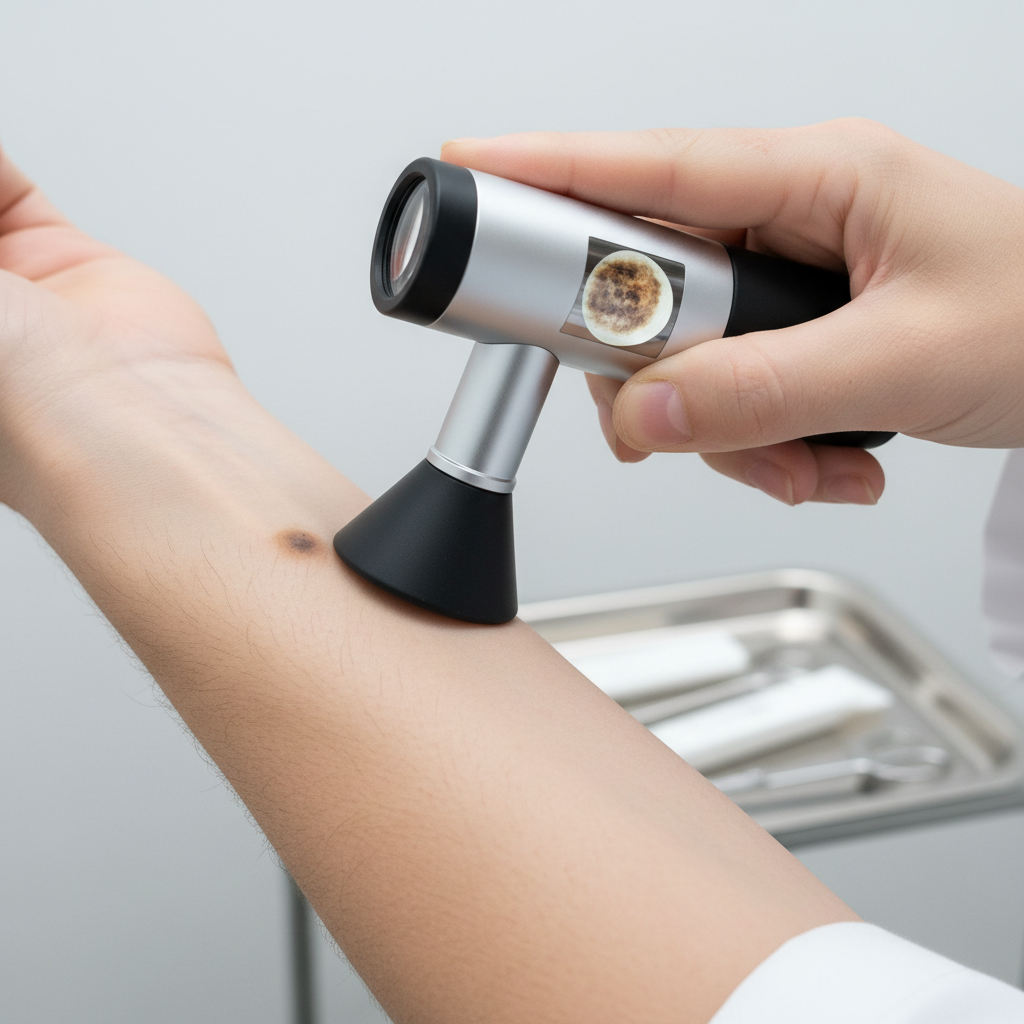


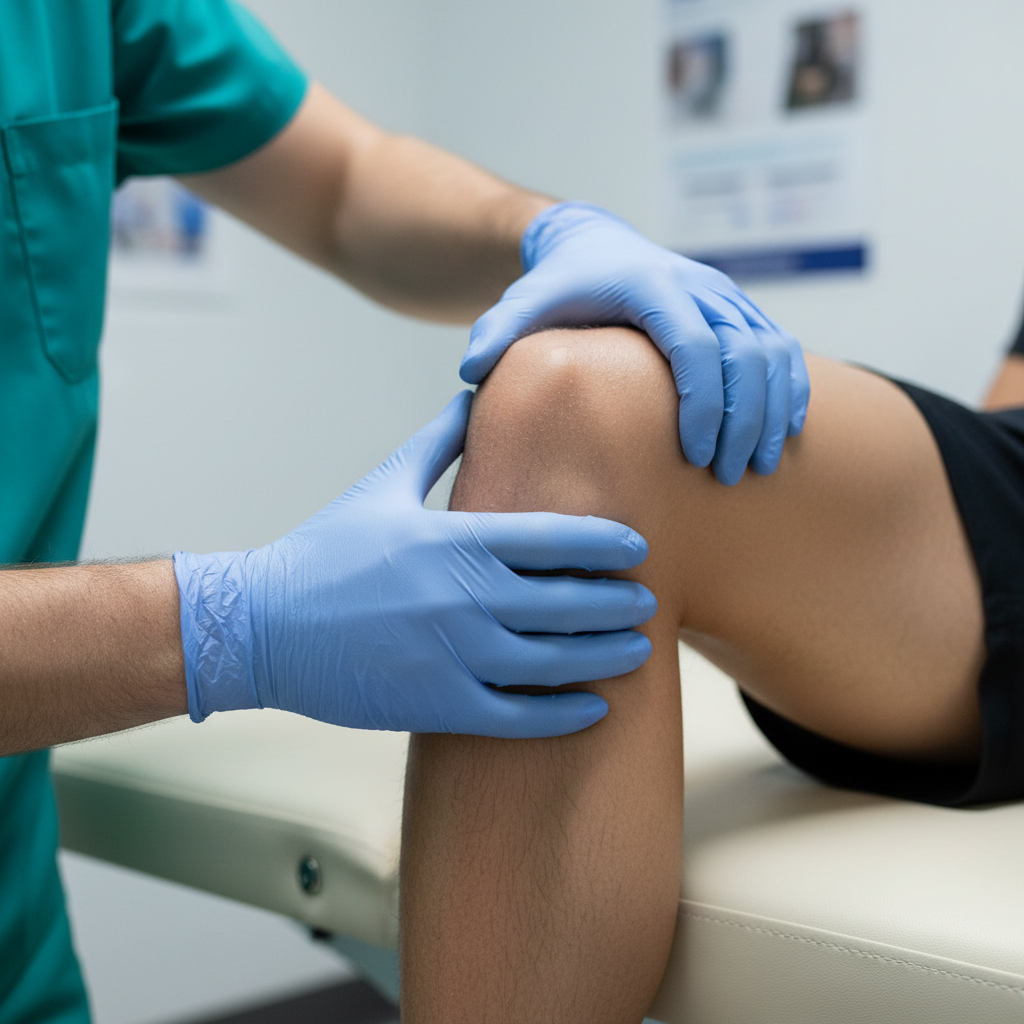
Click any tile to open the full case study →
Numbers don't lie.
Neither does your analytics dashboard.
avg views per Reel campaign
Before-and-afters that fill waiting rooms. We turn clinical transformations into content that patients share with their friends before they even book.
monthly impressions for our top cardiac program
Cardiologists who explain what other doctors won't. We build the thought leadership that turns a department into a destination.
views on a single therapist Reel
Mental health content that reduces stigma and fills schedules. We reframe the narrative from crisis to maintenance — and patients respond.
views on a single cosmetic reveal TikTok
Smile reveals that go viral. HIPAA-compliant consent workflows built into every intake. Your clinical excellence, finally visible.
CMOs. Practice owners.
All saying the same thing.
We went from a feed that looked like a hospital newsletter to content that people actually share at dinner parties. Pulse didn't just grow our followers — they made our CMO look like a visionary.

I was spending $40K a month on Google Ads and getting 62 inquiries. Eight months after Pulse launched our TikTok, I'm fielding 890 inquiries from a channel that costs a fraction of that. The math is embarrassing.

Our therapists were leaving because they didn't feel proud of our brand. Pulse rebuilt our identity from the ground up — now therapist retention is at 96% and we have a waitlist. That's not marketing ROI. That's culture ROI.

I thought LinkedIn was for job hunting. Pulse showed me it was a referral engine. We went from 45 physician referrals a month to 312. Every cardiologist in Chicago knows who we are now.

Let's audit
your feed.
We'll pull your current metrics, benchmark them against the top performers in your specialty, and show you exactly what's being left on the table. No obligation. No Canva templates.
Select your specialty
We'll benchmark you against the top performers in your vertical.
2024 Healthcare Social
Benchmark Report
How does your feed stack up? We analyzed 200+ healthcare accounts across 8 specialties — engagement rates, posting frequency, content mix, and follower growth benchmarks by vertical. 47 pages. No fluff.